CBAI Methodology
The following methodology is described based on the REIT securities strategy.
CBAI Probabilistic Approach strategy takes all four REIT specific fundamental categories into account, factors with highest correlation to market capitalization movements greatly impact conditional probabilities and thus are selected, rated and as a result a single probability of growth is returned. The current version takes into account all US REITs and its fundamentals data; prior probability of total market growth (macroeconomic factors) is currently set as neutral to the algorithm.
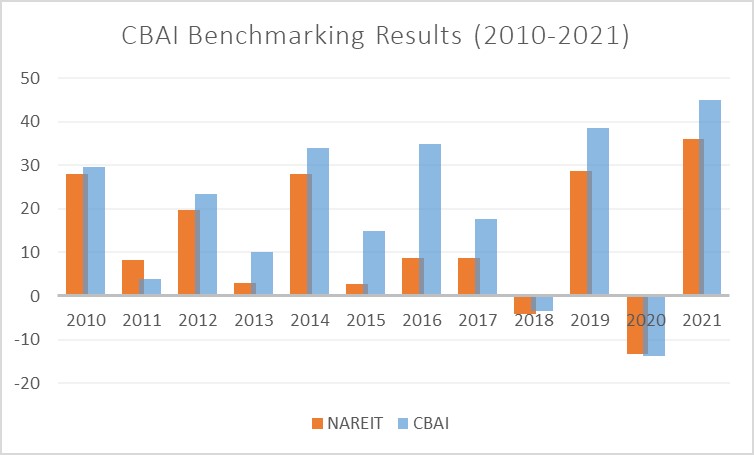
The CBAI REIT model’s returns are benchmarked against a custom index of all U.S. public traded REITs at market capitalization weights, the FTSE Nareit All Equity REITs. The following results were achieved for the 15 year benchmarking:

| CBAI | NAREIT | alpha | |
| 2010 | 29.55 | 27.95 | 1.60 |
| 2011 | 3.90 | 8.28 | -4.38 |
| 2012 | 23.48 | 19.7 | 3.78 |
| 2013 | 10.00 | 2.86 | 7.14 |
| 2014 | 33.93 | 28.03 | 5.90 |
| 2015 | 14.97 | 2.83 | 12.14 |
| 2016 | 34.77 | 8.63 | 26.14 |
| 2017 | 17.72 | 8.67 | 9.05 |
| 2018 | -3.56 | -4.04 | 0.48 |
| 2019 | 38.54 | 28.66 | 9.88 |
| 2020 | -13.71 | -13.3 | -0.41 |
| 2021 | 45.04 | 35.95 | 9.09 |

- Outperformance of the CBAI model portfolio vs. FTSE-NAREIT U.S. Real Estate Index in 2021 ~910 bps
- Dividend yield of the CBAI model portfolio vs. FTSE-NAREIT U.S. Real Estate Index in 2021: 3.01% vs 2.85%
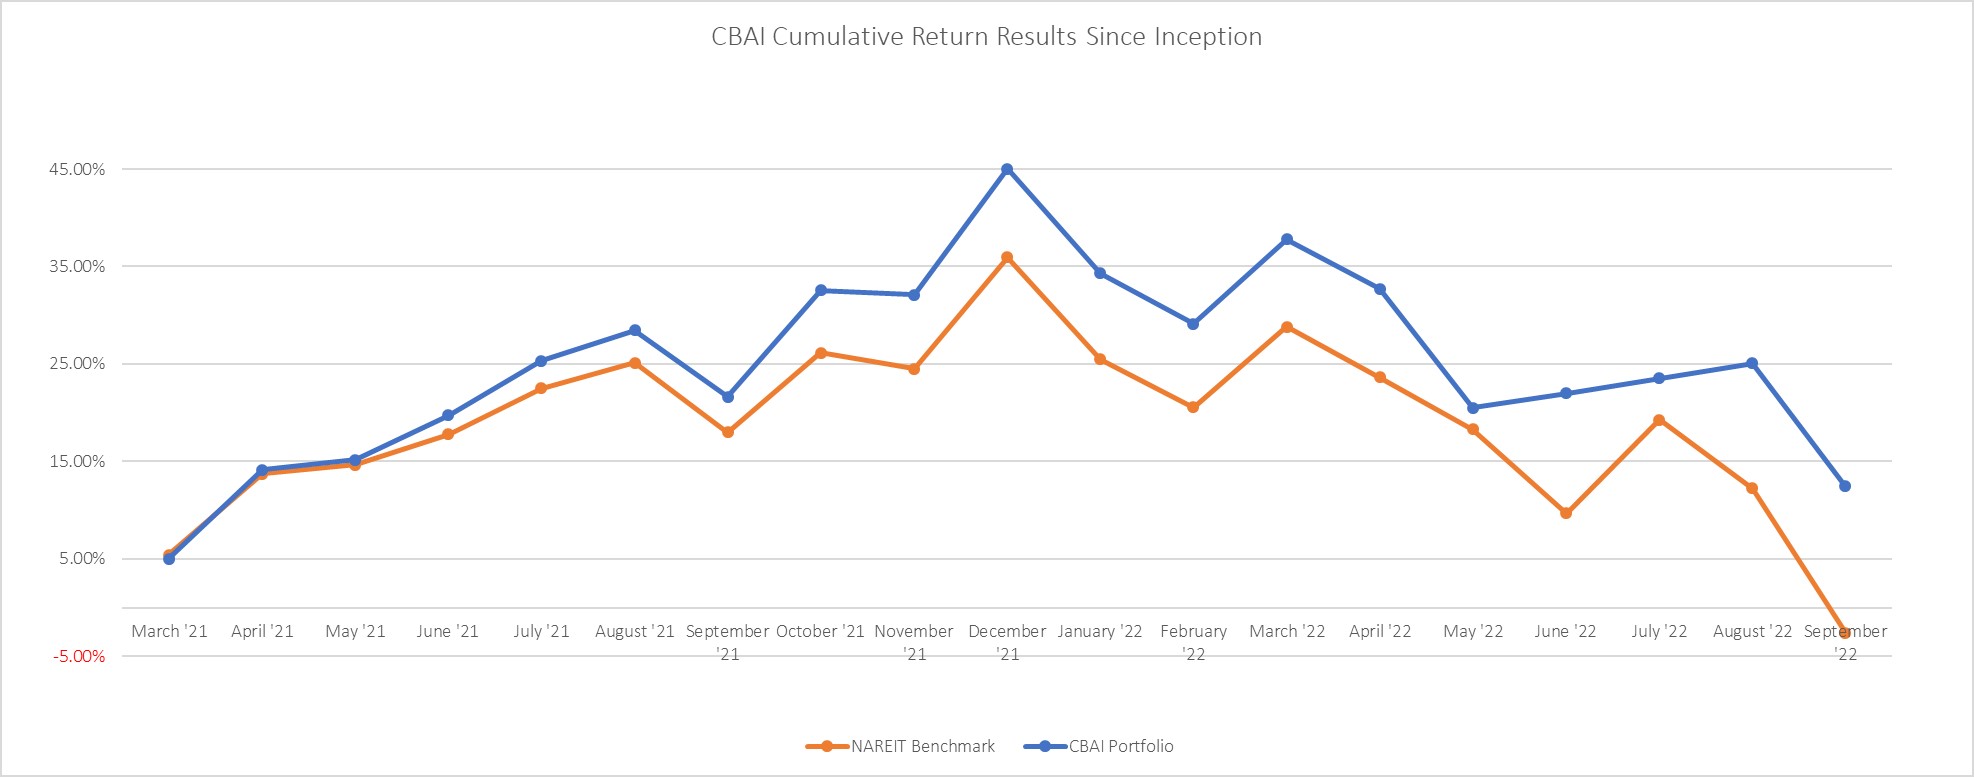
- Outperformance of the CBAI model portfolio vs. FTSE-NAREIT U.S. Real Estate Index as of September 30, 2022 on a trailing 12-months basis 990 bps
Methodological Overview
The CBAI Probabilistic Approach methodology consists of:
1) Determining a set of factors that correlate best to the market capitalization movements for each individual REIT,
2) Predicting direction of change in market capitalization of each REIT for each selected factor.
Precision in forecast models is derived from an intelligent model, analyzing correlations within external public data and market capitalization data, to understand how various factors affect the value of each REIT market cap,
3) Evaluating the strength of predictions for each factor and ranking its effectiveness,
4) Choosing individual factors selected using Bayes’ theorem; a single solution is returned as a percent of market cap appreciation, (ex. 75% chance of growth, hence 25% drop),
5) Making allocations based on the relative weight of each REIT’s market capitalization.
The CBAI Probabilistic Approach methodology 1,2 is not based on economic forecasts, but on statistical and machine learning techniques, with the objective to understand the relationship of factors and the market cap performance.
This methodology also successfully eliminates human bias in factor selection. CBAI approach is unique in that it goes beyond traditional fundamental financial and technical analysis as each predict from its corresponding factor is evaluated and weighted in its effectiveness of correct prognosis and then all factors are tallied up using Bayesian statistics into a single probability of growth.
Statistical Logic Behind Model Validation
Ordinary Least Squares (OLS) method is used for estimating the unknown parameters in a linear regression model. OLS is applied in time delayed arrays of data (each qualified fundamental factor to REIT Market Cap) to construct the regression line describing dependence and allowing making statistically significant predict in market capitalization movements.
Current version of the CBAI model uses 25 highest correlated fundamental factors on quarterly data for each REIT in OLS calculation – that results in 25 different predicts on market cap movement.
Each factor is evaluated from historical data in its effectiveness of correct prediction (e.g., fundamental factor “Revenue” – out of 100 predicts 75 predicts for market growth, it was correct 65 times when the market was up and 10 false positive predictions, 25 predict for market drop, 17 correct and 8 false negative predictions)
Bayes’ Theorem describes the probability of an event, based on prior knowledge of conditions that might be related to the event. In case of CBAI model each fundamental factor effectiveness is a prior knowledge of conditions that are related to market capitalization. Here is a well-known example that helps illustrate the idea
P(A│B)= (P(B│A)P(A))
(P(B))
the probability of event A (market capitalization growth) occurring given that B is true “Revenue” predicts market cap growth);
– the probability of event B occurring given that A is true. It can also be interpreted as the likelihood of market cap growth given a “Revenue” previously calculated effectiveness;
– prior probability of growth – it is “what we know about the market in general”, initially is set at neutral 50% and can be modified at manager’s discretion for each REIT or sector of REITs to account for market sentiment of other macro-economic changes (e.g., strong bull market for office sector should increase this parameter);
– probability of observing B respectively without any given conditions and can be rewritten as
P(B│A)P(A)+P(B│~A)P(~A)
where is the false positive and negative statistics for “Revenue” that were discovered in OLS calculations.
The formula can be rewritten in “human” format as follows:
Probability of market cap growth, when “Revenue” predicts growth is equal to statistical effectiveness of “Revenue” factor when market cap appreciated, times probability of “what we know about the market”, divided by sum of false positive and negative statistics of “Revenue”.
Bayes’ theorem is applied for all 25 highly correlated factors for each REIT with respect to their current predict value (“up” or “down”) and a single probability value is returned that accounts for different predictive strength or effectiveness of each factor.
CBAI Model Holdings and Property Sectors
Diversification of the model portfolio is maintained by holding approximately 50 or more positions. The purpose of diversification is to minimize unsystematic risk, and to provide reasonable assurance that no single security or class of securities will have a disproportionate impact on the total model. The model’s holdings will include securities in the following property sectors:
| Equity REITs Sectors | Equity REITs Sectors |
| Office | Lodging/Resorts |
| Industrial | Self-Storage |
| Retail | Health Care |
| Shopping Centers | Timber |
| Regional Malls | Infrastructure |
| Free Standing | Data Centers |
| Residential | Specialty |
| Apartments | |
| Manufactured Homes | Mortgage REITs Sectors |
| Single Family Homes | Home Financing |
| Diversified | Commercial Financing |
Excluded Investments
Certain REITs are excluded from the model due to the poor performance within the algorithm calculations. In general, poor performance for each company is caused by the lack of consistent data, or strong influence of other factors, such as negative news, management style etc. related to the specific company or industry. Such out of the scope factors greatly impact performance making statistically significant predict in market capitalization movements unreliable. Another reason is short fundamental factors history for newly formed REITs or publicly unavailable fundamentals data. These REITs are rerun at every rebalance period and will be added back into the pool if the behavior changes. “Black Swan events” (e.g. pandemia, news and events, failure of economic systems, wars etc.) are not modeled in our fundamental analysis and are beyond of scope of accounted factors.
1 Stuart, A.; Ord, K. (1994), Kendall’s Advanced Theory of Statistics: Volume I—Distribution Theory, Edward Arnold, §8.7; https://www.worldcat.org/title/kendalls-advanced-theory-of-statistics/oclc/30793688
2 Jason Altschuler, Victor-Emmanuel Brunel, Alan Malek of the Massachusetts Institute of Technology 77 Massachusetts Ave, Cambridge, MA 02139 Respectfully; https://jmlr.csail.mit.edu/papers/volume20/18-395/18-395.pdf
Philosophy: CBAI (completed in 2021 after 3 years of development by a team of PhDs and data scientists) is a REIT strategy run by an AI and machine learning algorithm. The CBAI REIT product is a long-only long-term strategy with quarterly reallocation with about 40 REIT stocks held in the portfolio at any given quarter.
We do not have a crystal ball – we believe in data science and measuring what we can measure to decrease the risk. By rigorously applying the latest advances in machine learning and probability theory, we let the model stay objective in its allocations. The algorithm largely ignores the macro sentiment and does not take into account consensus estimates. It focuses on company fundamentals instead. See full Methodology.
We identify the top 25 factors that historically have been correlated the best with the future value of the REIT Market Cap. Every quarter we update the model through a machine learning loop to feed latest financial results. Analyzing the results for all public REITs allows us to optimize the returns in the portfolio with REITs that are most likely to have the highest share price based on the past fundamentals performance.
However, like every investing tool, CBAI algorithm has its limitations, and should not be used alone for making an investment decision.
Disclaimer: Capital Brain, Monetarex, Inc and its employees are not Registered Investment Advisors or Financial Planners. The research reports and AI/ML algorithms and other market intelligence are provided for information purposes only. Our research and AI/ML algorithms do not constitute investment advice and readers should not make any investment decision without conducting their own due diligence or consulting their financial advisor about their specific situation.

