Private Capital Activity Q3’15 results: construction up, capital commitments down
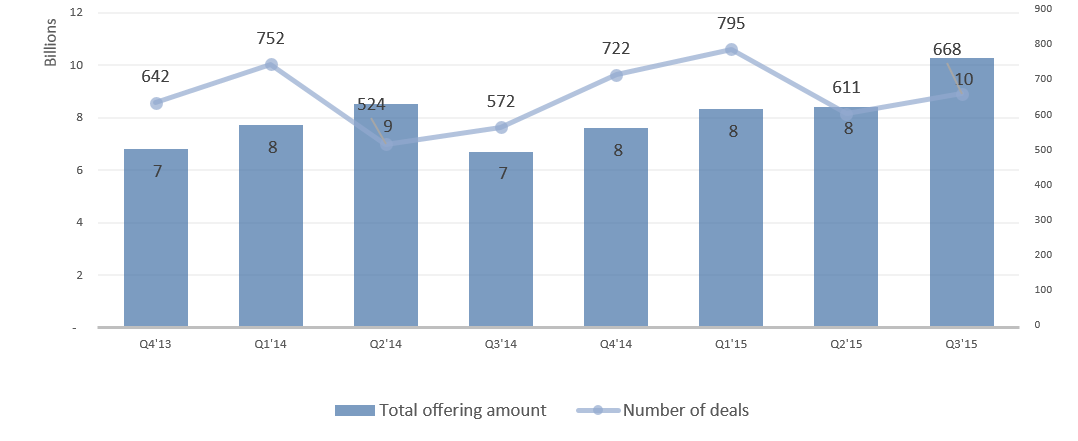
Monetarex has aggregated and reviewed the data in 668 Form D filings submitted to the SEC for the real estate industry group as of September 30, 2015, of which 401 are currently active. Total offering amount stands at approximately $10.3 billion as of September 30, 2015, with the Total recorded capital commitments of $3.2 billion (or a 31% capital commitments rate). There is a definite slowdown in the fundraising activity for the private capital.
The average historical capital commitment rate has been above 50%. In Q3’15 the capital commitments lowered even further (vs. 55% in Q1’15 and vs. 38% in Q2’15).The total number of active Real Estate Private Placement filings across all sectors increased by about 10%, from 611 to 668. Average minimum investment for the quarter stands at approximately $136 thousand.
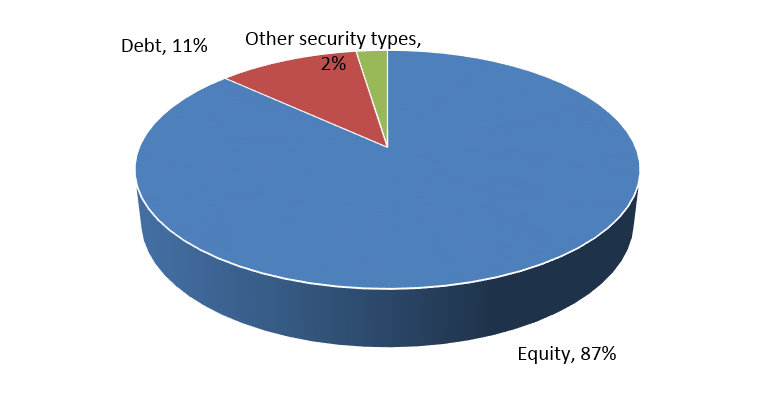
Currently, equity is clearly the preferred security type for real estate offerings. Convertible debt and LLC interests securities types included in “Other” are the second most popular alternative to equity. This capital structure data is in line with the results reported through June 30, 2015.
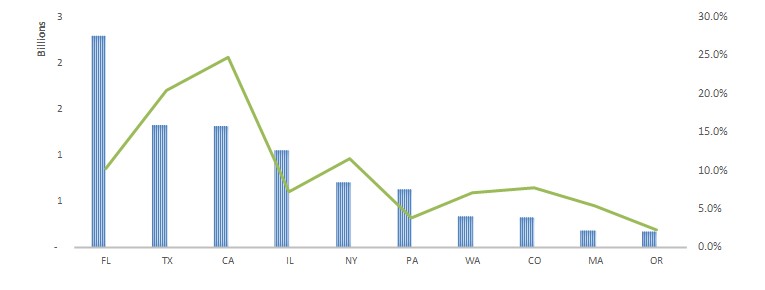
The geographic distribution of recorded capital commitments has changed from the previous quarter with the state of Florida leading the way. California has been the most active state for the private capital this year both by the amount of deals and by the total offerings amount. In Q3’2015 Florida outpaced the other states in terms of private real estate offerings with $2.3 billion in offerings spread across 45 deals (22% of total market activity). However, out of $2.3 billion in offerings, only $396 million were received in capital commitments this quarter.
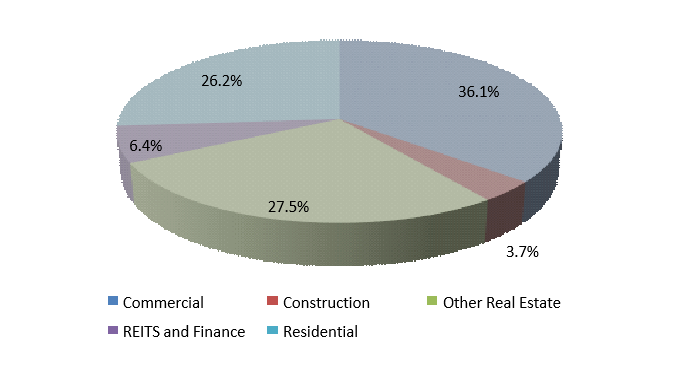
Almost 40% of Private Placement filings come from the Commercial Sector representing $3.2 billion across 241 offerings. Construction activity has been robust in 2015. As a result, private capital activity in the Construction Sector has increased as well (an increase from 1% to almost 4% of total number of deals). There were 25 opportunities filed in the Construction Sector during Q3’15 representing $246 million in offerings.
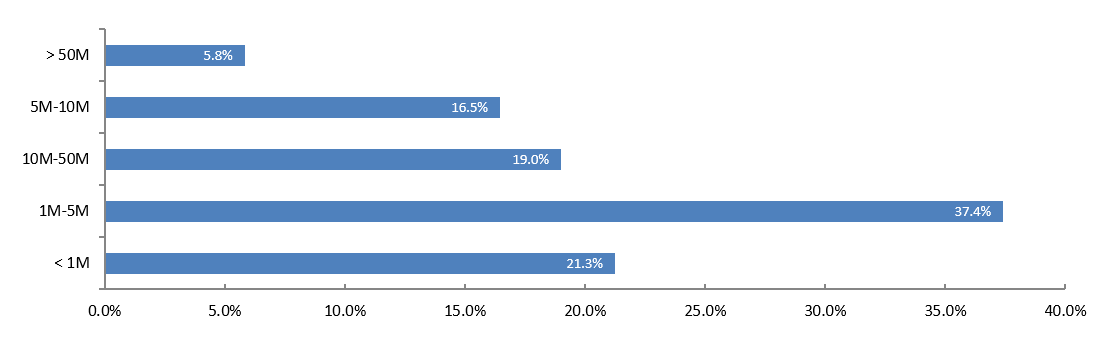
In Q3’15 the average size of the private capital deal was $15 million, an increase from $12 million in the previous quarter. The change is primarily due to the fact that the dealflow in the $10 million – $15 million range almost doubled.
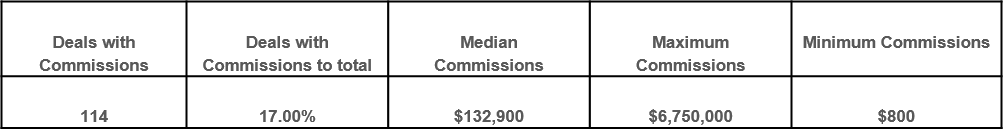
Despite the rise in popularity of crowdfunding and online investing, the use of traditional broker-dealers and placement agents still prevails. In Q3’15 17% of deals were launched through and anticipate to pay commissions on money raised to broker-dealers. The median commission is 4% assuming the raise is fully funded. In Q3’15 the commission range was 0.01%-15%.
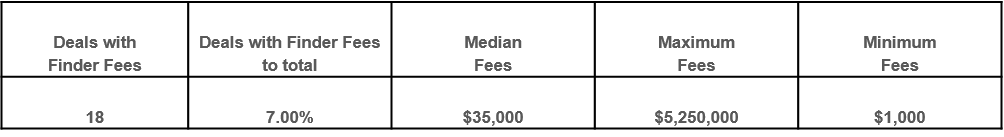
In Q3’15 7% of deals will have finder fees payouts on the money raised. The median fee is 2% assuming the raise is fully funded. In Q3’15 the finder fee range was 0.1%-10%.

Pingback : CapitalBrain » Crowdfunding platforms don’t diminish the role of the traditional broker-dealer