Q2’16: Market Volatility Does Not Affect Private Real Estate Capital
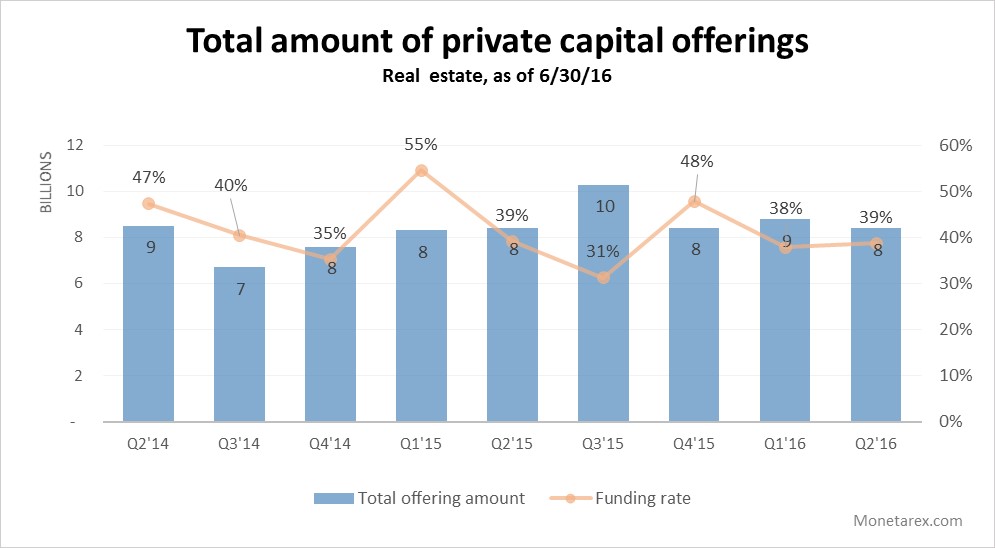
Monetarex has aggregated and reviewed the data in 679 Form D filings submitted to the SEC for the real estate industry group as of June 30, 2016, of which 392 (or 58% of total offerings) are currently active. Total offering amount stands at approximately $8.4 billion as of June 30, 2016, with the total recorded capital commitments of $3.2 billion (or a 39% capital commitments rate). The capital commitment rate in Q2’16 is below the historic average which has been around 50% (roughly in line with Q1’16). The total number of active Real Estate Private Placement filings experienced a substantial decline of about 29%, from 954 to 679. However, in historic terms Q1 and Q4 tend to be the most active quarters with Q2 and Q3 experiencing a usual decline in fundraising activity. The decline in the number of private deals in the marketplace did not translate into the drop in the volume of offerings. There were no red flags with respect to slowdown in the fundraising activity, and no indicators yet that there are tougher times ahead of us. Average minimum investment for the quarter increased over one and a half times from approximately $72 thousand to $114 thousand which is in line with the historic average.
Among the largest offerings this quarter: Five Point Operating Company, LLC with a $812 million raise and Ohio Capital Corporation for Housing with a $300 million fund (affordable housing). Five Point that markets itself as the largest mixed-use developer in coastal California has recently delayed its planned IPO due to the choppy public markets and has consolidated ownership of four large mixed-use projects in San Francisco and Los Angeles. Lennar, Five Point’s parent still remains its largest investor.

In Q2’16 the average size of the private capital deal was $12.3 million, an increase from a $9.2 million average deal size reported last quarter.

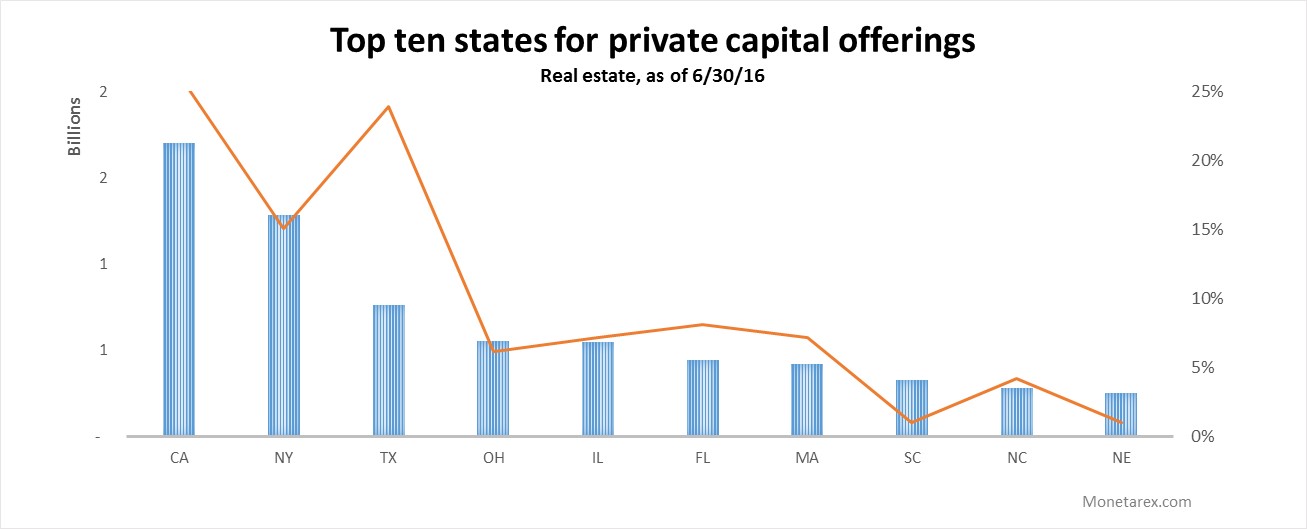
The geographic distribution of recorded capital commitments has changed from the previous quarter with the top three states – our usual suspects California, New York, and Texas – accounting for more than half (!) of all private capital activity. In Q2’16 California outpaced the other states in terms of private real estate offerings with $1.7 billion in offerings spread across 106 deals. California has been the most active state for the private capital this quarter by the amount of deals, as well. Overall, the top ten states in the country accounted for almost 60% of all private capital offerings. Interestingly, Texas has seen more activity than the runner-up, New York, (97 deals vs. 61 deals) but those deals were a lot smaller.
| State | Total Offerings ($) | Number of Deals |
| CA | 1,701,397,752 | 106 |
| NY | 1,285,912,976 | 61 |
| TX | 761,834,136 | 97 |
| OH | 551,734,355 | 25 |
| IL | 547,536,983 | 29 |
| FL | 441,499,750 | 33 |
| MA | 420,656,748 | 29 |
| SC | 325,850,000 | 4 |
| NC | 284,128,825 | 17 |
| NE | 254,460,090 | 4 |
We are building the first machine learning real estate data platform. Looking for resources to help you find private commercial real estate investors? Sign up for a free trial to access the data as well as in-depth real-time profiles of private companies and their investment activity.

